Ishikawa meaning in six steps. Kaoru Ishikawa, a prominent Japanese quality management consultant, made significant contributions to the development of quality initiatives in Japan and globally. Born in 1915, Ishikawa is best known for developing the Ishikawa or fishbone diagram, a tool for systematic analysis of cause and effect, widely used in quality control and problem-solving. His work emphasized the importance of total quality control to improve organizational performance, advocating for quality management to be integrated into every aspect of a business.
Table of Contents
ToggleIshikawa Meaning – 6 Steps
The Ishikawa diagram, also known as the fishbone diagram or cause-and-effect diagram, is a tool used for identifying and organizing potential causes of a problem. The process of creating an Ishikawa diagram can generally be broken down into six steps:
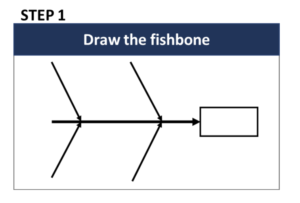
DRAW THE FISHBONE
Draw the template on your whiteboard/flipchart. The idea is that the “head“ shows the problem (effect) and “bones” indicate the impact of the causes.
Step 1
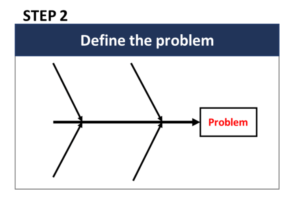
DEFINE THE PROBLEM
Agree on a problem statement (effect). Write it at the center-right of the whiteboard or flipchart. This ensures that everyone has the same understanding of the problem you’re addressing.
Ishikawa Meaning – Step 2
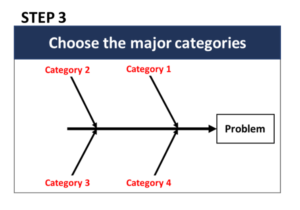
CHOOSE THE MAJOR CATEGORIES
Brainstorm the major (specific) categories of causes of the problem. If this is difficult use generic (4M/6M) categories: MEN, METHOD, MACHINE, MATERIAL, MEASURE, MOTHER NATURE. Write the 4M or 6M categories of causes as branches from the main arrow.
Ishikawa Meaning – Step 3
IDENTIFY CAUSES WITHIN EACH CATEGORY
The team should brainstorm all possible causes that fit into each category. Ask “Why does this happen?” As each idea is given, the facilitator writes it as a branch from the appropriate category. To be sure that all potential causes are investigated use 4M Checklist. Use the 3 Legged 5 WHYs approach.
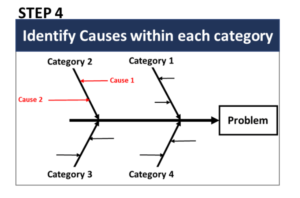
Step 4
GO DEEPER TO IDENTIFY SUB-CAUSES
If you determine that you can break something down into smaller points, create branches from the main point. Again ask “Why does this happen?” about each cause. Write sub-causes branching off the causes. Continue to ask “Why?” and generate deeper levels of causes. You can use the 5W1H approach.
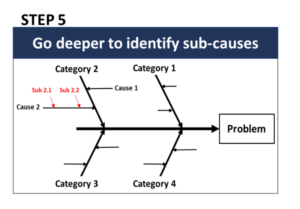
Ishikawa Meaning – Step 5
ANALYZE YOUR DIAGRAM – FINAL ISHIKAWA MEANING
In this stage, you should have a diagram showing all of the possible causes that the team identified. Depending on the complexity and importance of the problem, you can now investigate the most likely causes further. During the investigation team should test which of these possible causes is contributing the most to the problem.
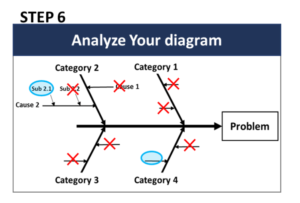
Ishikawa Meaning – Step 6
Ishikawa Meaning – Sumarry
Try to follow the six steps of Ishikawa and you will see that most of the root causes will be identified effectively and problems will be solved fast. The majority of problems require a simple approach and Ishikawa is a tool that could help a lot. Keep it simple because there is no need to activate advanced problem-solving tools for any issue.
The beauty of the Ishikawa diagram lies in its simplicity and versatility. It applies to a wide range of problems, from minor operational hiccups to significant process inefficiencies. The key is to start with a clear definition of the problem, systematically categorize potential causes, brainstorm possibilities, analyze and prioritize these causes, and finally, develop action plans. This disciplined approach ensures that no stone is left unturned in the quest to find the real causes of a problem.

Nenad Marcetic is CIO at Lean Community. He has over 15 years of experience in Lean Management. He is a graduate of Quality Management. He has conducted more than 250 management system audits in various companies and industries (manufacturing, food and beverage, agriculture, IT services, finance, retail, mining). Since 2015 in a global automotive company, where he is responsible for process standardization and the implementation of the IATF standard.


