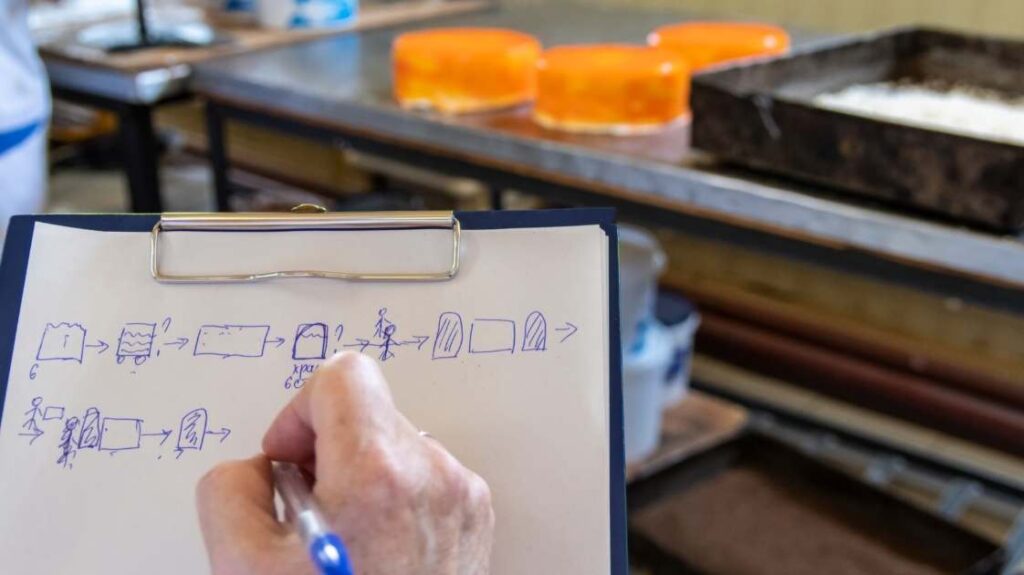
Value Stream Mapping (VSM) is one of the most powerful tools in Lean Management. It is a visual method used to analyze, design, and improve the flow of materials and information required to deliver a product or service to the customer.
Simply put, Value Stream Mapping (also called VSM Map) allows organizations to see their processes end-to-end — from raw materials to finished products — identifying both value-added and non-value-added steps.
When people ask, “What is Value Stream Mapping?”, the short answer is:
It is a visual map that illustrates how value flows through a process and helps eliminate waste.
By creating a Value Stream Map, teams can pinpoint inefficiencies, bottlenecks, delays, and waste (known in Japanese as Muda), enabling continuous improvement and higher operational performance.
Table of Contents
ToggleThe Origins and History of Value Stream Mapping
The idea behind VSM can be traced back to early industrial engineering practices in the early 20th century. However, its modern form emerged from the Toyota Production System (TPS) — the foundation of Lean Manufacturing.
During the 1980s, Taiichi Ohno and Shigeo Shingo introduced flow diagrams at Toyota to visualize material and information movement. These diagrams evolved into the standardized VSM Map we use today.
In 1999, Mike Rother and John Shook popularized the method in their book “Learning to See”, published by the Lean Enterprise Institute. This work made Value Stream Mapping (VSM) a cornerstone of global Lean practice.
Today, Lean Value Stream Mapping is applied not only in manufacturing but also in healthcare, logistics, IT, and office environments to visualize and improve any kind of process.
The Purpose of Lean Value Stream Mapping
The goal of Lean Value Stream Mapping is to identify and eliminate all forms of waste — those activities that consume resources but add no value to the customer.
Lean defines seven types of waste, often expanded to eight:
-
Overproduction – making more than required or earlier than needed.
-
Waiting – idle time when people, materials, or information are delayed.
-
Transport – unnecessary movement of materials or products.
-
Overprocessing – performing more work than necessary or adding excessive quality.
-
Inventory – holding too much raw material, work-in-progress, or finished goods.
-
Motion – unnecessary movement of workers (reaching, walking, searching).
-
Defects – errors requiring rework or scrap.
-
Unused employee creativity – failing to use employees’ ideas and experience.
By visualizing these wastes on a VSM Map, teams can redesign processes to reduce lead time, improve flow, and increase customer value.
Value Stream Mapping Symbols (VSM Symbols)
A standard VSM Map uses a set of VSM Symbols — graphical elements representing key parts of the process. These Value Stream Mapping symbols are universal, ensuring that any Lean practitioner can interpret the map.
Common Value Stream Mapping Symbols
| Symbol | Description |
|---|---|
| 🏭 Process Box | Represents a production process or activity. Includes data such as cycle time (C/T), changeover time (C/O), number of operators, and uptime. |
| 🏠 Supplier / Customer | Depicted as a factory icon — marks the start (supplier) or end (customer) of the value stream. |
| 🔺 Inventory / Storage | Shown as a triangle labeled “I” (Inventory). Indicates material stock or buffer between processes. |
| 🚚 Transport / Shipment | A truck icon showing how materials move between locations. Often includes frequency (e.g., 1x per day). |
| 🔁 Push Arrow | Thick arrow showing production pushed forward without a signal from the next process (non-Lean behavior). |
| 🗂️ Supermarket | Shelf symbol showing controlled inventory used in pull systems. |
| 🧾 Kanban Card | Represents visual signals used to replenish materials. Indicates the link between pull processes. |
| 🔄 Information Flow | Dashed lines show how production is controlled (orders, schedules, ERP signals). |
| 👷 Operator Icon | Represents the number of workers assigned to a process. |
| 💥 Kaizen Burst | Starburst shape highlighting improvement opportunities. |
By combining these Value Stream Mapping symbols, you can create a clear and detailed visual of how materials and information flow through the system.
Current-State VSM Map
The current-state VSM Map shows how the process operates today — before any improvements.
To build it, follow these Value Stream Mapping steps:
Step-by-Step: How to Create a VSM
-
Select the product or service family to analyze.
-
Start with the customer — record the demand and takt time.
-
Work backwards through the process, collecting real data at each step (cycle time, changeover time, inventory, etc.).
-
Draw the process boxes in sequence and connect them with material flow arrows.
-
Add information flow above the process — show how orders, schedules, or Kanban signals are transmitted.
-
Add inventory triangles between processes to show waiting and storage.
-
Draw the timeline at the bottom — separate value-added time from waiting time.
-
Calculate lead time (LT) and process time (PT) to see how much of the total time adds value.
This Value Stream Mapping example reveals inefficiencies: excess inventory, long waiting periods, or misaligned production schedules.
A completed current-state map is your “snapshot” of how value currently flows (or fails to flow) through the organization.
Future State VSM: Designing an Improved Process
Once the current state is clear, the next step is to design the Future State VSM — a vision of the optimized process after improvement.
The future-state VSM map represents how the value stream should operate under Lean principles.
When designing the Future State VSM, consider the following questions:
-
Can the process flow continuously without interruptions?
-
Where can we implement pull systems (Kanban, supermarkets)?
-
How can we reduce batch sizes and waiting times?
-
Where can we remove non-value-adding steps?
-
How can we balance workloads and align processes with takt time?
Typical Lean Improvements in Future State VSM
-
Introducing continuous flow between compatible processes.
-
Implementing Kanban pull systems instead of push production.
-
Reducing setup/changeover time using SMED.
-
Balancing workloads through Heijunka (leveling).
-
Improving layout to minimize transport and motion.
-
Applying 5S to maintain workplace organization.
The Future State VSM is not just a vision — it’s a roadmap for action. Each improvement identified becomes part of a Kaizen implementation plan, with assigned owners and deadlines.
Work Standardization and Value Stream Mapping
After implementing the changes from your Future State VSM, sustaining the results requires work standardization.
Work standardization means documenting the best known method to perform each task and ensuring everyone follows it consistently.
This step links VSM with the TWI Job Instruction method — a structured approach for training employees to standard work.
Without standardization, improvements fade over time. With it, every operator, supervisor, and manager can detect deviations early and maintain the gains achieved through Value Stream Mapping.
Value Stream Mapping Examples Across Industries
Manufacturing Example
A furniture manufacturer used VSM to analyze its order-to-delivery process.
The current-state VSM showed that the total lead time was 6 weeks, although actual production took only 3 days. The rest was waiting, overproduction, and excess inventory.
By implementing a Future State VSM, introducing smaller batches and synchronized scheduling, the company reduced lead time to 3 weeks and cut finished-goods inventory by 50%.
Logistics Example
A distribution company applied Value Stream Mapping in the warehouse. The analysis revealed long picking routes and delays in truck loading.
By rearranging the layout, introducing flow racks, and leveling loading waves, the firm reduced waiting time by 35% and improved productivity by 20%.
Office Example
VSM in the office (administration) can visualize processes like invoice approval or employee onboarding.
One service company used VSM to map its recruitment process and discovered unnecessary approval steps and long delays between interviews. After simplifying the workflow, the hiring cycle was reduced from 30 to 14 days.
These Value Stream Mapping examples show that the tool is applicable far beyond the factory floor — anywhere value is created, VSM can help improve it.
Using Software for Value Stream Mapping
Creating VSM maps is easier today thanks to digital tools.
Popular Value Stream Mapping software includes:
-
Microsoft Visio – with dedicated Lean templates and symbols.
-
Lucidchart – browser-based with collaboration features.
-
Miro – for interactive online mapping.
-
Edraw Max or SmartDraw – for professional process diagrams.
-
eTWI.io – integrates VSM with digital standard work and training.
These tools make it simple to create, share, and update VSM Maps during workshops or Kaizen events.
Value Stream Mapping Training and Skill Development
Value Stream Mapping training helps teams understand how to apply VSM effectively.
Participants learn:
-
How to create current and future state maps,
-
How to use VSM symbols,
-
How to calculate takt time and lead time,
-
How to design Lean flows and pull systems,
-
How to implement improvements through Kaizen.
Training sessions often end with real-life workshops where participants map their own company processes — transforming theory into measurable results.
Conclusion: Why Every Organization Needs VSM
Value Stream Mapping (VSM) is more than a diagram — it’s a mindset of seeing the entire value creation process.
By visualizing the current condition, designing the future state, and applying Lean improvements, companies gain control over their processes, reduce waste, and deliver higher value to customers faster.
Whether applied in production, logistics, or the office, Lean Value Stream Mapping connects people, processes, and purpose — turning complexity into clarity.
The first step to improvement is to see.
The best way to see is through Value Stream Mapping.

Dr. Bartosz Misiurek is a co-founder of a few start-ups like Leantrix, Lean Community, Leancoin, etwi, Lean Global Consulting, Sallar. He is a CEO at LeanTrix Ltd., Leancoin Ltd, Do Lean IT OU, and a Member of the Board at Astral Hodling OU. Author of the book “Standardized Work with TWI: Eliminating Human Errors in Production and Service Processes.” He works as Sr Manager and TWI Global Coach at Automotive Company.

He is a Senior Consultant of the TWI program and Lean Management at LeanTrix. He is also a leader in the startup project - etwi system. He was a member of a global team that implemented the TPM system for several automotive plants in Europe, Asia, South America and North America.
